Publicité
Strait of Hormuz disruption and regional competition
Port-Louis must improve its performance relative to competitors in East and South Africa
Par

Partager cet article
Strait of Hormuz disruption and regional competition
Port-Louis must improve its performance relative to competitors in East and South Africa
Geopolitical tensions in the Gulf region, encompassing Houthi activity in the Red Sea and Iran’s effective closure of the Strait of Hormuz, have compelled major shipping lines to reroute via the Cape of Good Hope. extending voyage durations by approximately two weeks on key Asia-Europe and Asia-North America trades. This increases trade costs (an extra day at sea is equivalent to a 1%-2% import tariff at destination), fuel consumption driving shippers to seek reliable intermediate stops.
Port-Louis will likely benefit temporarily because of weaknesses in its hard (port facilities) and soft (regulatory) infrastructures (see below). Importantly, I would like to call attention to the deterioration of Port-Louis’ performance relative to competitors in the region since at least 2010, and to the urgency of addressing the need for regulatory reform.
In a recent insight from the MCB, Mauritius as a Strategic Shipping Node: Capitalising on Gulf Challenges and Cape – Rerouting, Katty Boudon documents the benefits for Port-Louis resulting from this disruption. She notes that during the Red Sea crisis linked to Houthi attacks, port calls increased and export proceeds in this category rose by some 45% in 2024 and bunker calls in March 2026 rose to 294 vessels from 207 the prior month. She also notes that despite these gains, Mauritius is not yet fully capitalising on the opportunity created by sustained global disruptions. A major source of concern remains relating to port productivity, particularly lengthy ship turnaround times.
To address these infrastructure-related (hard component of trade costs) weaknesses, the Mauritian Government announced an investment of approximately Rs 5.4 billion by the Mauritius Ports Authority (MPA) to support the expansion of the cruise jetty, the construction of a small jetty for bunker barges, the acquisition of additional tugs, and the expansion of the Mauritius Container Terminal Looking further to 2050, the Port Master Plan estimates total investment needs of Rs 56.3 billion, focused on expanding container handling capacity, upgrading core infrastructure, and improving port efficiency and productivity. identifies seven major infrastructure projects.
In a policy brief by the Charles Telfair Centre, Towards a more competitive and Greener Port-Louis Harbor, Myriam Blin draws attention to the soft side of trade costs: regulatory reform. She details several challenges: (i) separating regulatory ownership and the operational functions from the Mauritius Ports Authority (MPA) to remove the conflict of interest; (ii) address entrenched labour practices in the Cargo Handling Corporation (CGCL); (iii) focus on strategic opportunities (concentrating on regional transshipment --under threat from upcoming improvements at Toamasina port-- as global shipping giants will not be attracted by a small market). As with most regulatory reforms, rents are difficult to address through the political process
Figure 1 compares performance across 8 East and South African competing ports for 2010 and 2023, two years sufficiently apart to detect change in performance. These ports are in competition for transshipments and bunker fuel activities, the relevant niche for Port-Louis. Arrows trace changes in throughput and turnaround time. Upward movement reflects increased scale (mostly expanded improved hardware infrastructure). A leftward movement reflects improved operational efficiency (mostly improved regulatory environment). A rightward shift also indicates increased congestion. Toamasina stands out as increased congestion and Port-Louis as the port with very little movement. Djibouti Cape Town and Durban have increased as have Mombasa and Dar Es Salaam increased decreased congestion. In short, Port-Louis is losing ground.
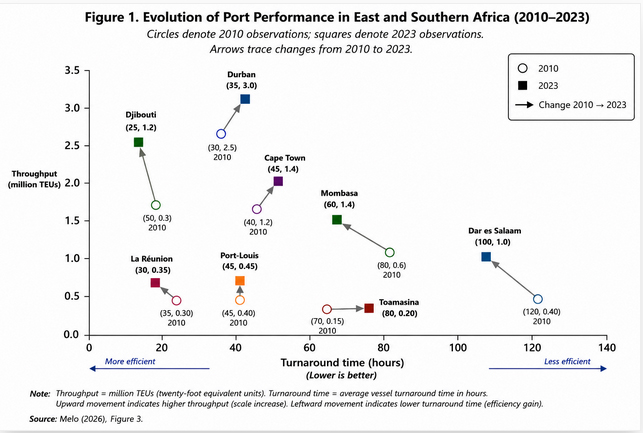
Note: See Melo (2026) “Benchmarking Mauritius’ Growth Performance” for construction of comparable indices. This measure captures efficiency and scale. The World Bank’s Container Port Performance Index (CPPI) controls for scale. Note that neither measure accounts for the open sea facing of Port-Louis (see here for a critique of CPPI). Relative ranking holds when one accounts for lost days due to bad weather.
Source: Melo (2026, figure 3)
In an update of the Mauritian miracle over a stretch of 50 years, I note that Mauritius had the same average yearly GDP growth of 4.0 percent as the average for Sub-Saharan Africa (SSA). Mauritius is no longer an exceptional performer. The post-2010 period marks a clear deceleration in Mauritius’ growth trajectory, reinforcing the view that the country has transitioned from a high-growth outlier to an average performer among SSA countries. I then compare the evolution of Mauritius relative to the average for the World Bank’s upper-middle-income (UMI) for three widely available indicators of performance. Figure 2 shows that port performance is, by far, the weakest link in the group. (Only within-group comparisons make sense.)
Figure 2: Mauritius performance is weakest on port efficiency
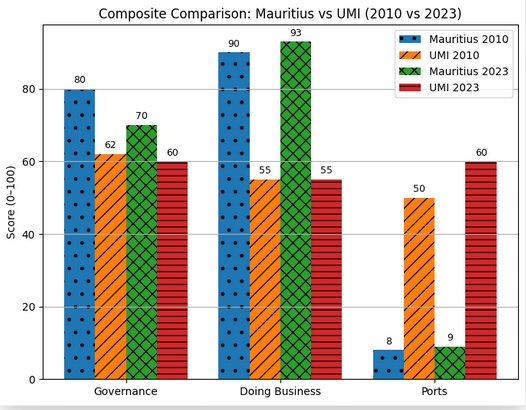
Notes: Except for Mauritius, each indicator is the average for 55 Upper-Middle-Income (UMI) countries as defined in the World Bank’s Upper-Middle-Income group. For each indicator, values normalized to 100 (i.e. the country with the highest value in the UMI sample is attributed a score of 100). Higher values reflect stronger performance. The CPPI index controls for scale so, unlike figure 1, small ports are not at a disadvantage.
Governance: WGI indicator is average of the 6 components in figure 1 included in WGI.
Doing Business: Time to complete the 7 steps to open a business. World Bank
Ports: CPPI index for containers Thruput/average turnaround.
Source: Melo (2026) “Benchmarking Mauritius’ Growth Performance” figure 3
Conclusion: Navigating Port-Louis' need to implement reforms
The current geopolitical shifts in the Gulf and Red Sea regions have presented Mauritius with a unique, albeit temporary, strategic opportunity. While rerouting via the Cape of Good Hope has led to a significant 45% increase in export proceeds for certain categories and a surge in bunker calls as of March 2026, Port-Louis remains unable to fully capitalise on these global disruptions. The port is currently losing ground to regional competitors like Durban, Cape Town, Mombasa, and Djibouti, which have shown greater improvements in throughput and turnaround times since 2010.
To improve its status as a leading shipping node for transshipments and bunker fuel activities, Mauritius must resolve the "weakest link" in its economic profile: port performance. This requires addressing two weaknesses:
• Hard Infrastructure Upgrades: The government must follow through on the planned Rs 5.4 billion investment for jetty expansions and tug acquisitions, while looking toward the Rs 56.3 billion required for the 2050 Port Master Plan.
• Soft Infrastructure Reform: Urgency is needed to address regulatory deficiencies, including the separation of regulatory and operational functions within the Mauritius Ports Authority (MPA) and the modernization of labor practices at the Cargo Handling Corporation (CGCL).
As Mauritius transitions from a high-growth outlier to an average performer among Sub-Saharan African and upper-middle-income countries, the efficiency of Port-Louis will be a primary determinant of its future economic trajectory.
Addressing hard infrastructure deficiencies requires scarce resources subject to competing claims. Addressing soft infrastructure reforms requires political will. Better benchmarking should help.
References
Blin, M. (2026) “Towards a More Competitive and Greener Port Louis Harbor”, Charles Telfair Policy Brief, https://charlestelfaircentre.com/towards-more-competitive-and-greener-port-louis-harbour Ketty Boudou “Mauritius as a Strategic Shipping Node: Capitalising on Gulf Challenges and Cape - Rerouting“
World Bank (2025) The Container Port Performance Index: 2020 to 2024: Lessons Learned, https://openknowledge.worldbank.org/server/api/core/bitstreams/695e8bdc-eb9a-439a-a8d5-228593831ce8/content
Publicité
Publicité
Les plus récents