

Publicité

Macroeconomic Policy and Poverty (2)

● <B>Social Welfare and Poverty</B>
- There exists already a whole range of social welfare programmes in the country, which cut across various sectors, such as health, education, housing and social security. Almost 60 % of total government expenditure is devoted to the ?Community and Social Services? which absorbed Rs 28.6 billion in 2005-06. In nominal terms, such expenses have been increasing by an average of 10 % over the past few years. A major chunk is taken up by social security, which accounts for 40 % of government social expenses, as indicated by the charts below:
 |
- Social security programmes are found to benefit mostly the elderly, the poor and the needy, as some of these, like Basic Widow?s Pension, Basic Invalidity Pension and Social Aid are means-tested and are geared towards specific groups in society. Based on HBS 2001-02 data, it is observed that 22% of such transfer incomes go to the poorest decile group. Should basic pensions and social aid be discontinued, the proportion of poor households (assuming a poverty line of half median household income per adult equivalent) would increase from nearly 8 % to around 14 % in 2001-02. It is estimated that they were lifting around 6% of all households out of poverty, most of whom coming from the lowest three income decile groups. It is also found that among all the income transfers, the Basic Retirement Pension (BRP) is contributing the most to lift households out of poverty. It is estimated that if BRP were discontinued in 2001-02, the proportion of poor households with elderly persons would have increased from 7% to 21%. BRP is a more important social safety-net for households with elderly persons only. Should it be discontinued, it would have increased the poverty rate from 13% to 49% in 2001-02. These are shown in the following tables:
|
12 However, with regard to government expenditure on education and based on HBS 2001-02 data analysis, it is observed that the lowest income group benefits the least from the service as illustrated below:
Publicité
Publicité
Les plus récents

Meurtre de bébé Adriano à Roche-Bois
Jean Daniel Perrine jugé apte à être interrogé
Manière de voir
L’identité mauricienne existe : Nous sommes tous des «créoles» parce que de sangs entre… mêlés

Great Place To Work®
Lancement de Great Leader Lens™, une IA pour transformer le feedback en action

Mo Kiltir
Faire honneur à l’artiste
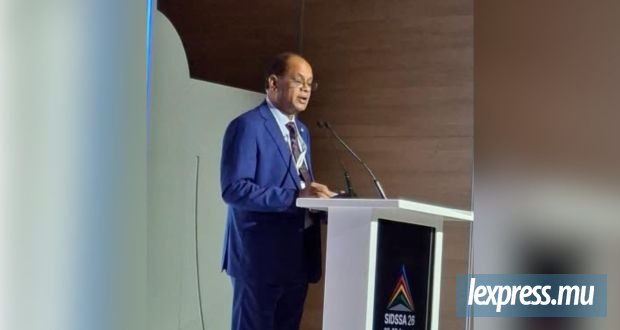
«Sustainable Infrastructure Development Symposium South Africa»
Repenser les infrastructures pour plus de résilience